Project Overview
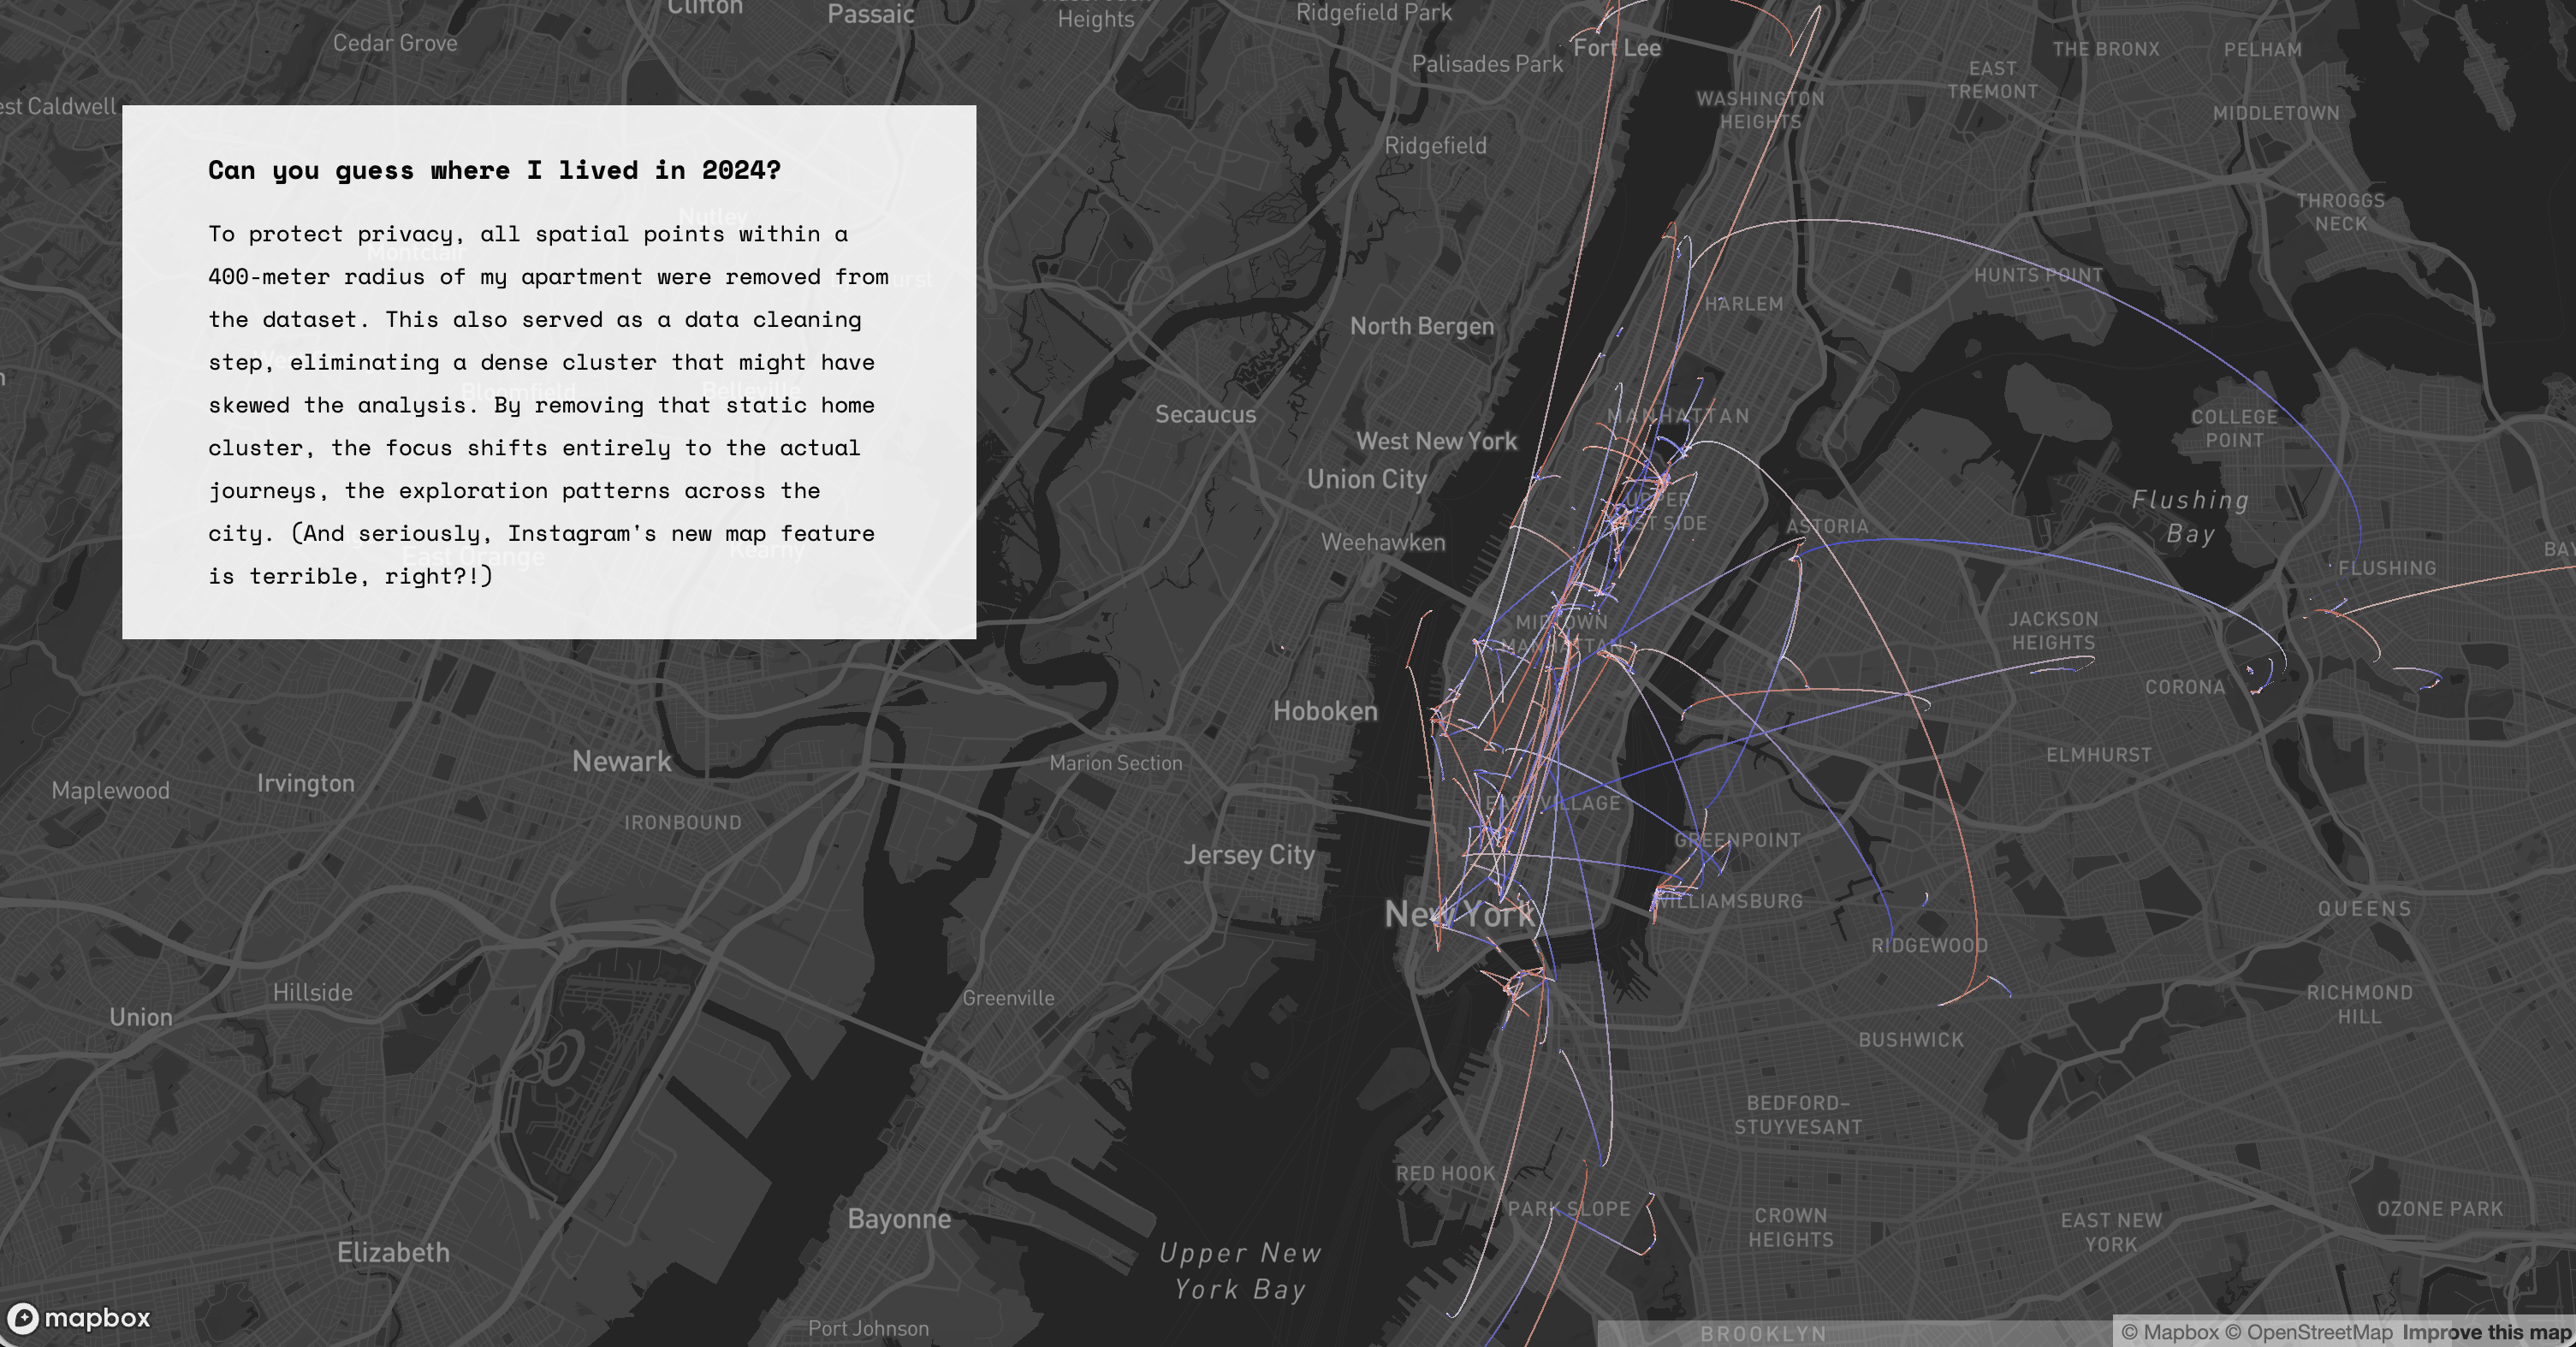
This data journal draws on the geotags of my iPhone photos from 2024, organized by day, to figure out what these digital breadcrumbs can really tell us about our mobility patterns, habits, stomping grounds, and maybe the boundaries we set for ourselves without realizing it.
Methodology: It started by extracting the geolocation metadata, that is basically the latitude and longitude coordinates from every single iPhone photo I took in 2024. From January 1st right through to December 31st. Each photo then became like a distinct point on a map, a spatial point. But here's the clever part, weaving them together. Sequential photos taken on the same day were linked up with an arc, forming a trajectory. At the beginning of each new day, the trajectory was reset. These daily trajectories were exported in JSON format and visualized using Deck.gl in combination with Mapbox GL. Finally, a scrollytelling framework implemented in JavaScript was applied to integrate the visualizations into an interactive data journal where the visuals, the map, update dynamically to match the text you're reading.
Data Source: iPhone photo geolocation metadata, 2024-01-01 to 2024-12-31